官方教材:
10 Minutes to pandas
pandas Cookbook
中文版:http://pandas.apachecn.org/
大部分整理复制自用Python进行数据分析
1. 导入包 1 2 3 4 #导入numpy包 import numpy as np #导入pandas包 import pandas as pd
2. 一维数据分析 1 2 3 4 5 6 7 8 9 10 11 12 13 14 15 16 17 a=np.array([2,3,4,5]) #查询元素 a[0] #2 #切片访问 a[1:3] #array([3, 4]) #循环访问 for i in a: print(i) #2 #3 #4 #5 #数据类型 a.dtype #dtype('int64')
pandas分析series 1 2 import numpy as npimport pandas as pd
1 2 3 onedata = pd.Series([54.74 , 190.9 , 173.14 , 1050.3 , 181.86 , 1139.49 ], index=['a' , 'b' , 'c' , 'd' , 'e' , 'f' ]) onedata.describe()
count 6.000000
mean 465.071667
std 491.183757
min 54.740000
25% 175.320000
50% 186.380000
75% 835.450000
max 1139.490000
dtype: float64
190.9
173.14
1 2 3 s1=pd.Series([1 ,2 ,3 ,4 ],index=['a' ,'b' ,'c' ,'d' ]) s2=pd.Series([10 ,20 ,30 ,40 ],index=['a' ,'b' ,'e' ,'f' ]) s3=s1+s2
a 11.0
b 22.0
c NaN
d NaN
e NaN
f NaN
dtype: float64
a 11.0
b 22.0
dtype: float64
1 2 s3 = s1.add(s2,fill_value = 0 ) s3
a 11.0
b 22.0
c 3.0
d 4.0
e 30.0
f 40.0
dtype: float64
3. 二维数据分析 NumPy分析二维数据 1 2 3 4 5 a=np.array([ [1 ,2 ,3 ,4 ], [5 ,6 ,7 ,8 ], [9 ,10 ,11 ,12 ] ])
4
array([1, 2, 3, 4])
array([1, 5, 9])
6.5
array([ 2.5, 6.5, 10.5])
array([5., 6., 7., 8.])
pandas分析二维数组(DataFrame) 1 2 3 4 5 6 7 8 9 salesDict={ '购药时间' :['2018-01-01 星期五' ,'2018-01-02 星期六' ,'2018-01-06 星期三' ], '社保卡号' :['001616528' ,'001616528' ,'0012602828' ], '商品编码' :[236701 ,236701 ,236701 ], '商品名称' :['强力VC银翘片' ,'清热解毒口服液' ,'感康' ], '销售数量' :[6 ,1 ,2 ], '应收金额' :[82.8 ,28 ,16.8 ], '实收金额' :[69 ,24.64 ,15 ] }
1 2 from collections import OrderedDict
1 2 salesOrderDict=OrderedDict(salesDict)
1 2 salesDf=pd.DataFrame(salesOrderDict)
应收金额 商品编码 购药时间 实收金额 商品名称 销售数量 社保卡号 0 82.8 236701 2018-01-01 星期五 69.00 强力VC银翘片 6 001616528 1 28.0 236701 2018-01-02 星期六 24.64 清热解毒口服液 1 001616528 2 16.8 236701 2018-01-06 星期三 15.00 感康 2 0012602828
应收金额 42.533333
商品编码 236701.000000
实收金额 36.213333
销售数量 3.000000
dtype: float64
24.64
应收金额 82.8
商品编码 236701
购药时间 2018-01-01 星期五
实收金额 69
商品名称 强力VC银翘片
销售数量 6
社保卡号 001616528
Name: 0, dtype: object
0 82.8
1 28.0
2 16.8
Name: 应收金额, dtype: float64
1 2 salesDf[['商品名称' ,'销售数量' ]]
商品名称 销售数量 0 强力VC银翘片 6 1 清热解毒口服液 1 2 感康 2
1 2 salesDf.loc[:,'购药时间' :'销售数量' ]
购药时间 实收金额 商品名称 销售数量 0 2018-01-01 星期五 69.00 强力VC银翘片 6 1 2018-01-02 星期六 24.64 清热解毒口服液 1 2 2018-01-06 星期三 15.00 感康 2
4. 数据框复杂查询:条件判断 1 2 querySer=salesDf.loc[:,'销售数量' ]>1 type(querySer)
pandas.core.series.Series
0 True
1 False
2 True
Name: 销售数量, dtype: bool
应收金额 商品编码 购药时间 实收金额 商品名称 销售数量 社保卡号 0 82.8 236701 2018-01-01 星期五 69.0 强力VC银翘片 6 001616528 2 16.8 236701 2018-01-06 星期三 15.0 感康 2 0012602828
5. 查看数据集描述统计信息 1 fileNameStr='./cnntest.xlsx'
1 2 xls = pd.ExcelFile(fileNameStr) salesDf = xls.parse('Sheet3' )
rowNo 类型 类型.1 凭证抬头文本 凭证行项目文本 0 1 因公临时出国(境) Fee_4 设计付安某某某某刘某某等14人某某马来西亚机票 设计付安某某某某刘某某等14人某某马来西亚机票 1 2 差旅费 Fee_0 油技新疆杨国林报销上井期间费用 油技新疆杨国林报销上井期间费用 2 3 差旅费 Fee_0 油技新疆郭某某报销办事期间费用 油技新疆郭某某报销办事期间费用
(10000, 5)
1 2 salesDf.loc[:,'rowNo' ].dtype
dtype('int64')
rowNo count 10000.00000 mean 5000.50000 std 2886.89568 min 1.00000 25% 2500.75000 50% 5000.50000 75% 7500.25000 max 10000.00000
rowNo int64
类型 object
类型.1 object
凭证抬头文本 object
凭证行项目文本 object
dtype: object
6. 数据清理 6.1 列名设置 重命名列 1 2 colNameDict = {'rowNo' :'编号' }
1 salesDf.rename(columns=colNameDict,inplace = True )
编号 类型 类型.1 凭证抬头文本 凭证行项目文本 0 1 因公临时出国(境) Fee_4 设计付安某某某某刘某某等14人某某马来西亚机票 设计付安某某某某刘某某等14人某某马来西亚机票 1 2 差旅费 Fee_0 油技新疆杨国林报销上井期间费用 油技新疆杨国林报销上井期间费用 2 3 差旅费 Fee_0 油技新疆郭某某报销办事期间费用 油技新疆郭某某报销办事期间费用 3 4 差旅费 Fee_0 维修调整00月份海贴成本入WBS 维修调整00月份海贴成本入WBS 4 5 差旅费 Fee_0 袁姗报销渤海00号拖航费、某某费及倒班费 袁姗报销渤海00号拖航费、某某费及倒班费
以下整理复制自:Pandas在读取csv时如何设置列名–常用方法集锦
自带列名文件读取 1 2 3 4 5 import pandas as pd df_example = pd.read_csv('Pandas_example_read.csv') # 等同于: df_example = pd.read_csv('Pandas_example_read.csv', header=0)
无列名文件读取 header=None使读取列名是系统默认的0,1,2… 序列号。
1 df_example_noCols = pd.read_csv('Pandas_example_read_withoutCols.csv', header=None)
列标题全替换
读表前替换
1 2 3 df_example = pd.read_csv('Pandas_example_read.csv', names=['A', 'B','C']) # 或者 df_example = pd.read_csv('Pandas_example_read.csv', header=0, names=['A', 'B','C'])
无标题文件需要将此处header=0改为header=None。
读表后替换
1 df_example = pd.read_csv('Pandas_example_read.csv') df_example.columns = ['A','B','C']
6.2 缺失值处理 1 print('before delete NA' ,salesDf.shape)
('before delete NA', (10000, 5))
1 2 3 4 salesDf=salesDf.dropna(subset=['编号' ],how='any' ) print('after delete NA' ,salesDf.shape)
('after delete NA', (10000, 5))
6.3 数据类型转换 1 2 salesDf['编号' ] = salesDf['编号' ].astype('float' ) salesDf.dtypes
编号 float64
类型 object
类型.1 object
凭证抬头文本 object
凭证行项目文本 object
dtype: object
1 2 3 testList='2019-02-22 Friday' .split(' ' ) testList
['2019-02-22', 'Friday']
定义函数:分割销售日期,获取销售日期
1 2 3 4 5 6 7 8 9 def splitTime (timeCloser) : timeList = [] for value in timeCloser: dateStr = value.split(' ' )[0 ] print('dateStr: ' +dateStr) timeList.append(dateStr) timeSer=pd.Series(timeList) return timeSer
1 2 3 4 timeSer = ['2018-02-22 Friday' ,'2018-02-23 Saturday' ] dateSer = splitTime(timeSer) dateSer
dateStr: 2018-02-22
dateStr: 2018-02-23
0 2018-02-22
1 2018-02-23
dtype: object
1 2 3 4 dateSer = pd.to_datetime(dateSer,format='%Y-%m-%d' ,errors = 'coerce' ) dateSer.head()
0 2018-02-22
1 2018-02-23
dtype: datetime64[ns]
1 2 3 4 fileNameStr='/Users/wangzulong/mycode/CAAtext/脱敏整理/cnntest.xlsx' xls = pd.ExcelFile(fileNameStr) salesDf = xls.parse('Sheet3' ) salesDf.head()
rowNo type Fee 凭证抬头文本 凭证行项目文本 0 1 因公临时出国(境) Fee_4 设计付安某某某某刘某某等14人某某马来西亚机票 设计付安某某某某刘某某等14人某某马来西亚机票 1 2 差旅费 Fee_0 油技新疆杨国林报销上井期间费用 油技新疆杨国林报销上井期间费用 2 3 差旅费 Fee_0 油技新疆郭某某报销办事期间费用 油技新疆郭某某报销办事期间费用 3 4 差旅费 Fee_0 维修调整00月份海贴成本入WBS 维修调整00月份海贴成本入WBS 4 5 差旅费 Fee_0 袁姗报销渤海00号拖航费、某某费及倒班费 袁姗报销渤海00号拖航费、某某费及倒班费
1 2 3 4 5 salesDf=salesDf.sort_values(by='Fee' , ascending=True , na_position='first' ) salesDf.head()
rowNo type Fee 凭证抬头文本 凭证行项目文本 4999 5000 差旅费 Fee_0 沈某某、姚琦报销差旅费 沈某某、姚琦报销差旅费 7815 7816 差旅费 Fee_0 维修韩某某冯某某等10人报销北京大庆等差旅费 维修韩某某冯某某等10人报销北京某某等差旅费559 7811 7812 差旅费 Fee_0 何林鑫报倒班费 何林鑫报倒班费 7810 7811 差旅费 Fee_0 检验00月00日报盘 检验QHES部李兵报销某某安全某某差旅费 7541 7542 差旅费 Fee_0 0.0杨某某报差旅费 0.0杨某某报差旅费
1 2 3 salesDf=salesDf.reset_index(drop=True ) salesDf.head()
rowNo type Fee 凭证抬头文本 凭证行项目文本 0 5000 差旅费 Fee_0 沈某某、姚琦报销差旅费 沈某某、姚琦报销差旅费 1 7816 差旅费 Fee_0 维修韩某某冯某某等10人报销北京大庆等差旅费 维修韩某某冯某某等10人报销北京某某等差旅费559 2 7812 差旅费 Fee_0 何林鑫报倒班费 何林鑫报倒班费 3 7811 差旅费 Fee_0 检验00月00日报盘 检验QHES部李兵报销某某安全某某差旅费 4 7542 差旅费 Fee_0 0.0杨某某报差旅费 0.0杨某某报差旅费
rowNo count 10000.00000 mean 5000.50000 std 2886.89568 min 1.00000 25% 2500.75000 50% 5000.50000 75% 7500.25000 max 10000.00000
1 2 3 4 5 6 7 querySer=salesDf.loc[:,'rowNo' ]>=2 print('before delete ' ,salesDf.shape) salesDf=salesDf.loc[querySer,:] print('after delete ' ,salesDf.shape)
('before delete ', (10000, 5))
('after delete ', (9999, 5))
rowNo type Fee 凭证抬头文本 凭证行项目文本 1 2 差旅费 Fee_0 油技新疆杨国林报销上井期间费用 油技新疆杨国林报销上井期间费用 2 3 差旅费 Fee_0 油技新疆郭某某报销办事期间费用 油技新疆郭某某报销办事期间费用 3 4 差旅费 Fee_0 维修调整00月份海贴成本入WBS 维修调整00月份海贴成本入WBS 4 5 差旅费 Fee_0 袁姗报销渤海00号拖航费、某某费及倒班费 袁姗报销渤海00号拖航费、某某费及倒班费 5 6 公务车费用 Fee_2 油技本付运输中子设备到阿布扎比中国邮政运输费 油技本付运输中子设备到阿布扎比中国邮政运输费
6.4 删除重复行 1 2 3 kpi1_Df=salesDf.drop_duplicates( subset=['Fee' , 'type' ] )
1 2 totalI=kpi1_Df.shape[0 ] totalI
10
rowNo type Fee 凭证抬头文本 凭证行项目文本 1 2 差旅费 Fee_0 油技新疆杨国林报销上井期间费用 油技新疆杨国林报销上井期间费用 5 6 公务车费用 Fee_2 油技本付运输中子设备到阿布扎比中国邮政运输费 油技本付运输中子设备到阿布扎比中国邮政运输费 10 11 通讯费 Fee_7 转00月电话费到研究院 转00月电话费到研究院 11 12 业务招待费 Fee_1 某某站-蒋常燕(专项)报销审计午餐费 某某站-蒋常燕报销(专项)审计午餐费 13 14 办公费 Fee_3 船舶上某某销上海办办公费、某某托运费、手续费 船舶上某某销上海办办公费、某某托运费、手续费 18 19 因公临时出国(境) Fee_4 设计报销巴西项目某某王振伍出差费用 设计报销巴西项目某某王振伍出差费用 20 21 工会经费 Fee_6 油化某某集成深圳00月工资某某 油化某某集成深圳00月工资某某 75 76 团队建设费 Fee_9 王新报团队建设费 王新报团队建设费 84 85 培训费 Fee_5 某某分公司支付某某用车费(中旅旅游) 某某分公司某某某某用车费(中旅旅游) 144 145 会议费 Fee_8 邱伟报销会务费 邱伟报销会务费
6.5 删除两表间重复行 Remove one dataframe from another with Pandas
pandas.DataFrame.merge
1 2 3 4 5 6 7 8 9 10 import pandas as pddf1 = pd.DataFrame({'A' : ['qwe' , 'wer' , 'wer' , 'rty' , 'tyu' , 'tyu' , 'tyu' , 'iop' ], 'B' : [ 5 , 6 , 6 , 9 , 7 , 7 , 7 , 1 ], 'C' : ['a' , 's' , 'd' , 'f' , 'g' , 'h' , 'j' , 'k' ]}) df2 = pd.DataFrame({'A' : ['wer' , 'tyu' ], 'B' : [ 6 , 7 ]}) df1
A B C 0 qwe 5 a 1 wer 6 s 2 wer 6 d 3 rty 9 f 4 tyu 7 g 5 tyu 7 h 6 tyu 7 j 7 iop 1 k
1 2 3 4 5 6 7 8 df = pd.merge( df1, df2, on=['A' , 'B' ], how='outer' , indicator=True ).query("_merge != 'both'" ).drop( '_merge' , axis=1 ).reset_index(drop=True ) df
A B C 0 qwe 5 a 1 rty 9 f 2 iop 1 k
7. 操作文件 7.1 空文件读取 parsing empty file with no columns
1 2 3 4 5 6 7 8 9 from pandas.io.common import EmptyDataError def read_data(file): try: df = pd.read_csv(file, delim_whitespace=True) except EmptyDataError: df = pd.DataFrame() return df
7.2 去除表标题 Remove header row in Excel using pandas
skip first row by parameters skiprows=1 or header=1 and then remove all only NaNs columns
1 2 df = (pd.read_excel('XXX.xlsx' , skiprows=2 , sheetname='XXX' ) .dropna(how='all' , axis=1 ))
7.3 操作txt文件 pandas操作txt文件的方便之处
1 2 3 4 5 6 7 8 9 10 11 12 13 14 15 16 17 18 19 20 21 22 23 24 25 26 27 28 29 30 31 32 33 34 import pandas # 加载txt,指定它的分隔符是 \t papa=pandas.read_csv('papa.txt',sep='\t') # 显示数据的前几行 papa.head() # 行数,不包括表头 rowNum=papa.shape[0] # 列数 colNum=papa.columns.size # 根据列对整表去重 uPapa=papa.drop_duplicates(['paxi_id']) # 获取一列去重后的值 uPaxiId=papa['paxi_id'].unique() # 计算一列的和 papa['grade'].sum() # 根据值过滤特定行 papa[ ( papa['grade'] == 50 ) | ( papa['grade'] == 100 ) ] # 计算某一列各个取值的个数 gPapa=papa.groupby('grade').size() # 用图形表示各个值 import matplotlib.pyplot as plt fig=plt.figure() # bar 和 barh 能切换x轴,y轴 gPapa.plot(kind='bar',grid=True) # 在需要显示的时候调用,会一次把所有的图都画出来 plt.show()
8. 数据选取与过滤 8.1 [ : ] 对行进行切片,前闭后开
1 2 3 4 df = pd.DataFrame({'A' : [1 , 2 , 3 , 4 , 5 , 6 , 7 , 8 ], 'B' : [ 5 , 6 , 6 , 9 , 7 , 7 , 7 , 1 ], 'C' : ['a' , 's' , 'd' , 'f' , 'g' , 'h' , 'j' , 'k' ]}) df
A B C 0 1 5 a 1 2 6 s 2 3 6 d 3 4 9 f 4 5 7 g 5 6 7 h 6 7 7 j 7 8 1 k
A B C 0 1 5 a 1 2 6 s 2 3 6 d
A B C 0 1 5 a 1 2 6 s 2 3 6 d 3 4 9 f
A B C 4 5 7 g 5 6 7 h 6 7 7 j 7 8 1 k
8.2 where 布尔查找 8.3 isin pandas.Series.isin
0 True
1 True
2 True
3 False
4 False
5 False
6 False
7 False
Name: A, dtype: bool
1 df.loc[df['C' ].isin(['d' ,'g' ])]
8.4 query 1 df.query(" A == 6 & (B == 6 | C =='h') " )
8.5 loc切范围 B C 1 6 s 2 6 d 3 9 f 4 7 g
1 2 3 4 5 6 7 8 9 10 11 df.loc[df['B' ] == 6 , 'test' ] = 1 df.loc[df['B' ] != 6 , 'test' ] = 0 df['test2' ] = 0 df.loc[(df['B' ] == 6 )&(df['C' ] == 's' ), 'test2' ] = 1 df
A B C test test2 0 1 5 a 0.0 0 1 2 6 s 1.0 1 2 3 6 d 1.0 0 3 4 9 f 0.0 0 4 5 7 g 0.0 0 5 6 7 h 0.0 0 6 7 7 j 0.0 0 7 8 1 k 0.0 0
8.6 iloc切位置 A B C test test2 1 2 6 s 1.0 1 2 3 6 d 1.0 0 3 4 9 f 0.0 0
8.7 ix混切 .ix is deprecated. Please use.loc for label based indexing or.iloc for positional indexing
/Users/wangzulong/.pyenv/versions/3.7.1/lib/python3.7/site-packages/ipykernel_launcher.py:1: DeprecationWarning:
.ix is deprecated. Please use
.loc for label based indexing or
.iloc for positional indexing
See the documentation here:
http://pandas.pydata.org/pandas-docs/stable/indexing.html#ix-indexer-is-deprecated
"""Entry point for launching an IPython kernel.
8.8 map与lambda 1 2 alist = [1 ,2 ,3 ,4 ] list(map(lambda s : s+1 , alist))
[2, 3, 4, 5]
1 df['A' ].map(lambda s:s*2 +1 )[1 :3 ]
1 5
2 7
Name: A, dtype: int64
8.9 contains 1 2 3 df[df['C' ].str.contains(r'^d' )]
A B C test test2 2 3 6 d 1.0 0
1 2 df[df['C' ].str.contains("f" )]
A B C test test2 3 4 9 f 0.0 0
列表内字符串匹配过滤 pandas.Series.str.contains
How to test if a string contains one of the substrings in a list?
Pandas filtering for multiple substrings in series
1 2 3 4 import pandas as pds = pd.Series(['cat' , 'hat' , 'dog' , 'fog' , 'pet' ]) s[s.str.contains('|' .join(searchfor))]
0 cat
1 hat
2 dog
3 fog
dtype: object
用re.escape转义非字母数字字符
1 2 3 4 5 import rematches = ['$money' , 'x^y' ] safe_matches = [re.escape(m) for m in matches] safe_matches
['\\$money', 'x\\^y']
1 2 test_safe_matches = pd.Series(['love$money' , 'y+x^y' , 'test1' , 'test2' ]) test_safe_matches[test_safe_matches.str.contains('|' .join(safe_matches))]
0 love$money
1 y+x^y
dtype: object
Replace whole string if it contains substring in pandas
1 2 3 dfreplace = pd.DataFrame({'name' : ['Bob' , 'Jane' , 'Alice' ],'sport' : ['tennis' , 'football' , 'basketball' ]}) dfreplace.loc[dfreplace['sport' ].str.contains('ball' ), 'sport' ] = 'ball sport' dfreplace
name sport 0 Bob tennis 1 Jane ball sport 2 Alice ball sport
9. 数据分类Categoricals 1 2 3 4 5 df = pd.DataFrame({"id" : [1 , 2 , 3 , 4 , 5 , 6 ], "raw_grade" : ['a' , 'b' , 'b' , 'a' , 'a' , 'e' ]}) df["grade" ] = df["raw_grade" ].astype("category" ) df["grade" ].cat.categories = ["very good" , "good" , "very bad" ] df.sort_values(by="grade" )
id raw_grade grade 0 1 a very good 3 4 a very good 4 5 a very good 1 2 b good 2 3 b good 5 6 e very bad
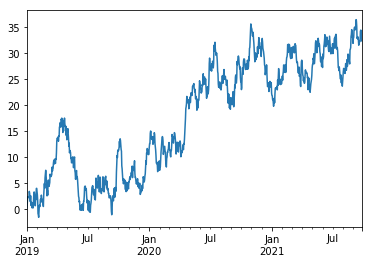
10. 绘图plot 1 2 3 4 5 6 7 8 9 import pandas as pdimport numpy as npimport matplotlib.pyplot as pltts = pd.Series(np.random.randn(1000 ), index=pd.date_range('1/1/2019' , periods=1000 )) ts = ts.cumsum() ts ts.plot()
<matplotlib.axes._subplots.AxesSubplot at 0x10ce02f60>
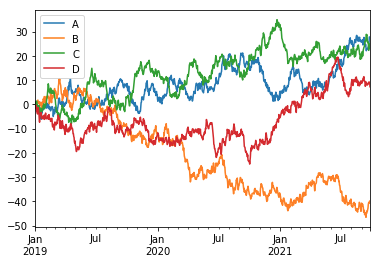
1 2 3 4 5 6 df = pd.DataFrame(np.random.randn(1000 , 4 ), index=ts.index, columns=['A' , 'B' , 'C' , 'D' ]) df = df.cumsum() plt.figure() df.plot() plt.legend(loc='best' )
<matplotlib.legend.Legend at 0x104852978>
<Figure size 432x288 with 0 Axes>
11. 数据合并concat What are the ‘levels’, ‘keys’, and names arguments for in Pandas’ concat function?
Combine two Pandas dataframes with the same index
pandas.concat
1 2 3 4 5 6 7 8 9 10 import pandas as pdd1 = pd.DataFrame(dict(A=.1 , B=.2 , C=.3 ), index=[2 , 3 ]) d2 = pd.DataFrame(dict(B=.4 , C=.5 , D=.6 ), index=[1 , 2 ]) d3 = pd.DataFrame(dict(A=.7 , B=.8 , D=.9 ), index=[1 , 3 ]) s1 = pd.Series([1 , 2 ], index=[2 , 3 ]) s2 = pd.Series([3 , 4 ], index=[1 , 2 ]) s3 = pd.Series([5 , 6 ], index=[1 , 3 ]) s3
1 5
3 6
dtype: int64
1 pd.concat([d1,d2],sort=False , axis=1 )
A B C B C D 1 NaN NaN NaN 0.4 0.5 0.6 2 0.1 0.2 0.3 0.4 0.5 0.6 3 0.1 0.2 0.3 NaN NaN NaN
1 pd.concat([s1.rename('A' ),s2.rename('A' )])
2 1
3 2
1 3
2 4
Name: A, dtype: int64
1 pd.concat([s1.rename('X' ),s2.rename('Y' ),s3.rename('Z' )],axis=1 )
X Y Z 1 NaN 3.0 5.0 2 1.0 4.0 NaN 3 2.0 NaN 6.0
11.1 轴axis Mixed Series and DataFrame with axis=0 (stacked)
1 pd.concat([s1.to_frame(), d1])
0 A B C 2 1.0 NaN NaN NaN 3 2.0 NaN NaN NaN 2 NaN 0.1 0.2 0.3 3 NaN 0.1 0.2 0.3
1 pd.concat([s1.to_frame('X' ), d1], sort=False )
X A B C 2 1.0 NaN NaN NaN 3 2.0 NaN NaN NaN 2 NaN 0.1 0.2 0.3 3 NaN 0.1 0.2 0.3
1 pd.concat([s1.to_frame('B' ), d1], sort=True )
A B C 2 NaN 1.0 NaN 3 NaN 2.0 NaN 2 0.1 0.2 0.3 3 0.1 0.2 0.3
1 pd.concat([s1.rename('X' ),s2, s3, d1],axis=1 )
X 0 1 A B C 1 NaN 3.0 5.0 NaN NaN NaN 2 1.0 4.0 NaN 0.1 0.2 0.3 3 2.0 NaN 6.0 0.1 0.2 0.3
11.2 合并join 1 pd.concat([d1, d2], axis=1 , join='outer' )
A B C B C D 1 NaN NaN NaN 0.4 0.5 0.6 2 0.1 0.2 0.3 0.4 0.5 0.6 3 0.1 0.2 0.3 NaN NaN NaN
1 pd.concat([d1, d2], axis=1 , join='inner' )
A B C B C D 2 0.1 0.2 0.3 0.4 0.5 0.6
1 pd.concat([d1, d2, d3], axis=1 , join_axes=[d1.index])
A B C B C D A B D 2 0.1 0.2 0.3 0.4 0.5 0.6 NaN NaN NaN 3 0.1 0.2 0.3 NaN NaN NaN 0.7 0.8 0.9
1 pd.concat([d1, d2, d3], axis=1 , join_axes=[d3.index])
A B C B C D A B D 1 NaN NaN NaN 0.4 0.5 0.6 0.7 0.8 0.9 3 0.1 0.2 0.3 NaN NaN NaN 0.7 0.8 0.9
11.3 忽视索引ignore_index 1 pd.concat([d1, d2],sort=False ).reset_index(drop=True )
A B C D 0 0.1 0.2 0.3 NaN 1 0.1 0.2 0.3 NaN 2 NaN 0.4 0.5 0.6 3 NaN 0.4 0.5 0.6
1 pd.concat([d1, d2], axis=1 , ignore_index=True , sort=False )
0 1 2 3 4 5 1 NaN NaN NaN 0.4 0.5 0.6 2 0.1 0.2 0.3 0.4 0.5 0.6 3 0.1 0.2 0.3 NaN NaN NaN
11.4 数据来源标签keys 1 pd.concat([s1, s2, s3], keys=['A' , 'B' , 'C' ])
A 2 1
3 2
B 1 3
2 4
C 1 5
3 6
dtype: int64
1 2 3 pd.concat( [s1, s2, s3], keys=[('A' , 'X' ), ('A' , 'Y' ), ('B' , 'X' )])
A X 2 1
3 2
Y 1 3
2 4
B X 1 5
3 6
dtype: int64
1 pd.concat([s1, s2], axis=1 , keys=['X' , 'Y' ])
X Y 1 NaN 3.0 2 1.0 4.0 3 2.0 NaN
1 pd.concat([s1.rename('U' ), s2.rename('V' )], axis=1 )
U V 1 NaN 3.0 2 1.0 4.0 3 2.0 NaN
1 pd.concat([s1.rename('U' ), s2.rename('V' )], axis=1 , keys=['X' , 'Y' ])
X Y 1 NaN 3.0 2 1.0 4.0 3 2.0 NaN
1 2 3 4 pd.concat( [d1, d2], axis=1 , keys=[('First' , 'X' ), ('Second' , 'X' )])
First Second X X A B C B C D 1 NaN NaN NaN 0.4 0.5 0.6 2 0.1 0.2 0.3 0.4 0.5 0.6 3 0.1 0.2 0.3 NaN NaN NaN
1 2 3 4 pd.concat( [s1.rename('Z' ), d1], axis=1 , keys=['X' , 'Y' ])
X Y Z A B C 2 1 0.1 0.2 0.3 3 2 0.1 0.2 0.3
1 2 3 4 d1_ = pd.concat( [d1], axis=1 , keys=['One' ]) d1_
One A B C 2 0.1 0.2 0.3 3 0.1 0.2 0.3
1 pd.concat([d1_, d2], axis=1 )
(One, A) (One, B) (One, C) B C D 1 NaN NaN NaN 0.4 0.5 0.6 2 0.1 0.2 0.3 0.4 0.5 0.6 3 0.1 0.2 0.3 NaN NaN NaN
11.5 传递dict参数 Passing a dict instead of a list
1 pd.concat({0 :d1, 1 :d2}, sort=False )
A B C D 0 2 0.1 0.2 0.3 NaN 3 0.1 0.2 0.3 NaN 1 1 NaN 0.4 0.5 0.6 2 NaN 0.4 0.5 0.6
11.6 层级levels 1 2 3 4 df = pd.concat( [d1, d2, d3], axis=1 , keys=['First' , 'Second' , 'Fourth' ]) df
First Second Fourth A B C B C D A B D 1 NaN NaN NaN 0.4 0.5 0.6 0.7 0.8 0.9 2 0.1 0.2 0.3 0.4 0.5 0.6 NaN NaN NaN 3 0.1 0.2 0.3 NaN NaN NaN 0.7 0.8 0.9
FrozenList([['First', 'Second', 'Fourth'], ['A', 'B', 'C', 'D']])
1 df.groupby(axis=1 , level=0 ).sum()
First Fourth Second 1 0.0 2.4 1.5 2 0.6 0.0 1.5 3 0.6 2.4 0.0
1 2 3 4 5 6 7 8 9 10 cats = ['First' , 'Second' , 'Third' , 'Fourth' , 'Fifth' ] lvl = pd.CategoricalIndex(cats, categories=cats, ordered=True ) df = pd.concat( [d1, d2, d3], axis=1 , keys=['First' , 'Second' , 'Fourth' ], levels=[lvl] ) df
First Second Fourth A B C B C D A B D 1 NaN NaN NaN 0.4 0.5 0.6 0.7 0.8 0.9 2 0.1 0.2 0.3 0.4 0.5 0.6 NaN NaN NaN 3 0.1 0.2 0.3 NaN NaN NaN 0.7 0.8 0.9
MultiIndex(levels=[['First', 'Second', 'Third', 'Fourth', 'Fifth'], ['A', 'B', 'C', 'D']],
codes=[[0, 0, 0, 1, 1, 1, 3, 3, 3], [0, 1, 2, 1, 2, 3, 0, 1, 3]])
CategoricalIndex(['First', 'Second', 'Third', 'Fourth', 'Fifth'], categories=['First', 'Second', 'Third', 'Fourth', 'Fifth'], ordered=True, dtype='category')
1 df.groupby(axis=1 , level=0 ).sum()
First Second Third Fourth Fifth 1 0.0 1.5 0.0 2.4 0.0 2 0.6 1.5 0.0 0.0 0.0 3 0.6 0.0 0.0 2.4 0.0
11.7 索引名称names names: list, default None
1 2 3 4 5 pd.concat( [d1, d2], sort=False , keys=[0 , 1 ], names=['lvl0' , 'lvl1' ])
A B C D lvl0 lvl1 0 2 0.1 0.2 0.3 NaN 3 0.1 0.2 0.3 NaN 1 1 NaN 0.4 0.5 0.6 2 NaN 0.4 0.5 0.6
11.8 不同目录合并 Pandas concat with different indices
1 2 3 pd.concat([d1,d2], sort=False , axis=0 )
A B C D 2 0.1 0.2 0.3 NaN 3 0.1 0.2 0.3 NaN 1 NaN 0.4 0.5 0.6 2 NaN 0.4 0.5 0.6
1 2 3 4 5 6 7 8 dfs = [d1, d2] cols = ['B' ,'C' ] keys = ['X' ,'Y' ] dm1 = d1.set_index(cols) dm2 = d2.set_index(cols) pd.concat([dm1,dm2], sort=False , axis=0 , keys=keys)
A D B C X 0.2 0.3 0.1 NaN 0.3 0.1 NaN Y 0.4 0.5 NaN 0.6 0.5 NaN 0.6